Charts and graphs help transform spreadsheet numbers into clear visual stories. In Google Sheets, a person can turn rows and columns of data into bar charts, line graphs, pie charts, scatter plots, and other visual formats with only a few clicks. Whether the spreadsheet tracks sales, budgets, projects, survey results, or website performance, a well-made chart can make patterns easier to understand and share.
TLDR: To make a chart or graph in Google Sheets, the user should organize the data into clear columns and rows, select the relevant range, and choose Insert > Chart. Google Sheets will create a chart automatically, and the user can adjust the chart type, labels, colors, title, legend, and data range in the Chart editor. A good chart uses clean data, a suitable chart type, and simple formatting so the main message is easy to understand.
Preparing the Data Before Creating a Chart
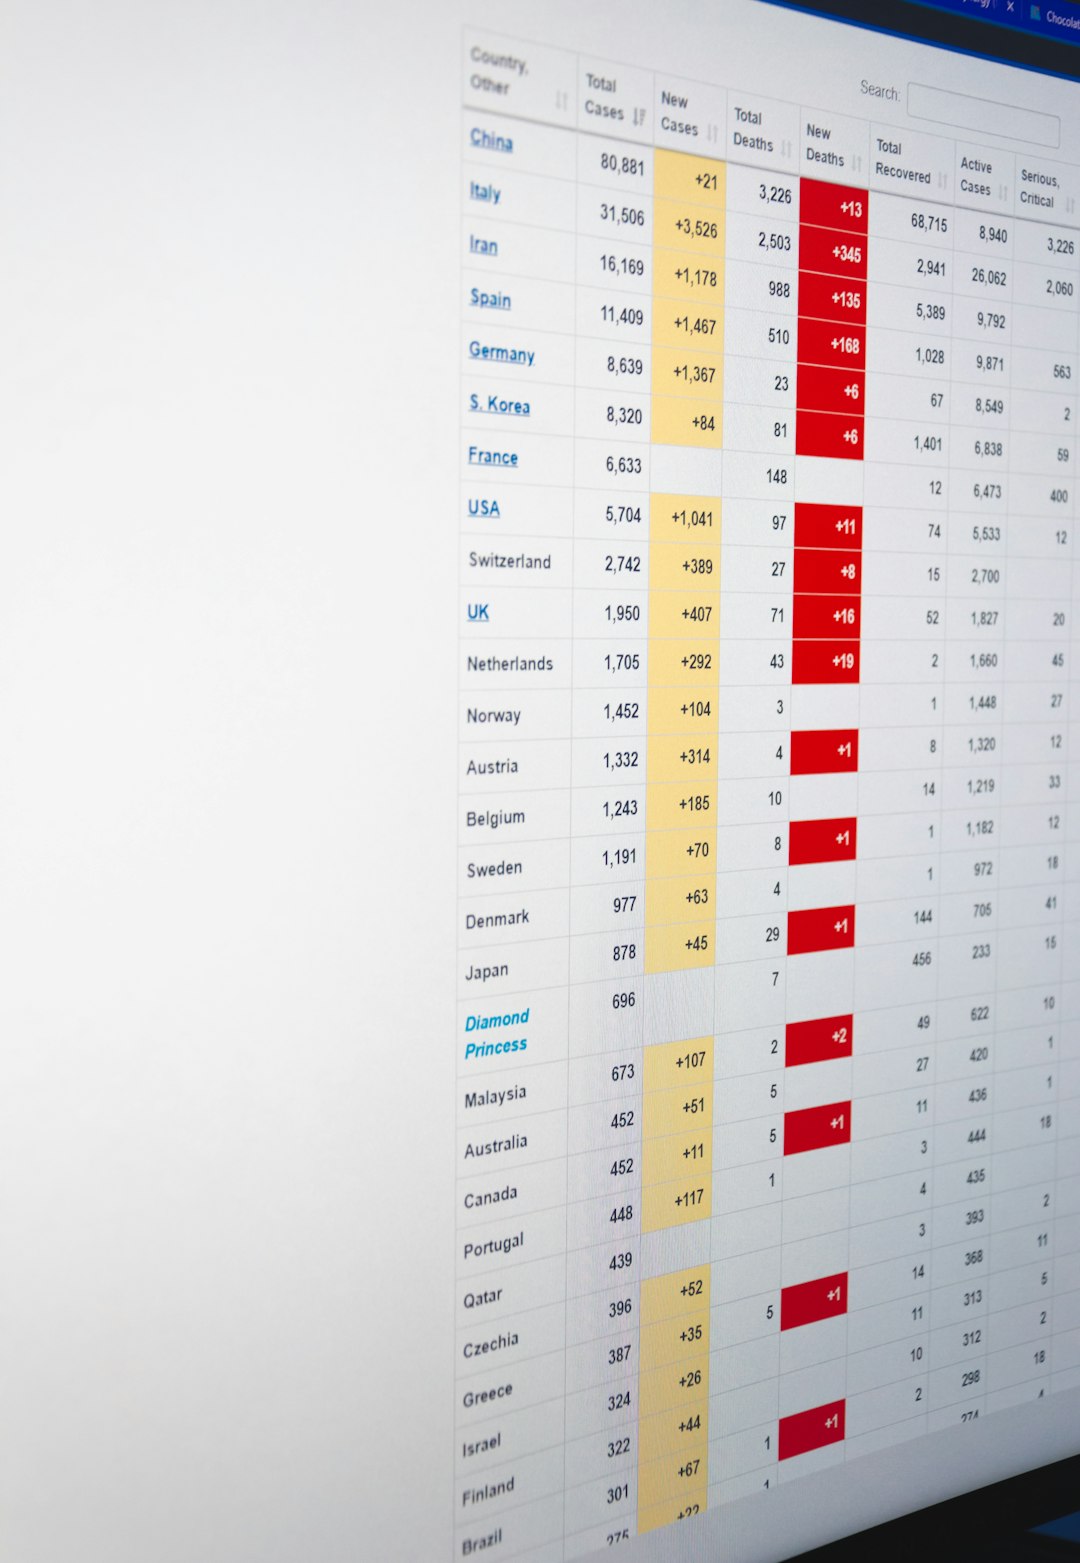
Before creating a chart, the spreadsheet should be organized in a way that Google Sheets can understand. The data should usually have headers in the first row, such as Month, Revenue, Expenses, or Visitors. These headers help Google Sheets identify labels, categories, and data series.
For example, a basic sales table might include one column for months and another column for sales totals. If the user wants to compare multiple values, such as sales and expenses, those values should be placed in separate columns next to the same category column. Clean structure is important because messy data can lead to confusing charts.
- Use clear column headings so the chart labels are meaningful.
- Keep related data together in one table whenever possible.
- Avoid blank rows or columns inside the selected data range.
- Use consistent number formats, such as currency, percentages, or dates.
- Remove unnecessary totals if they should not appear as part of the chart.
If the data includes dates, Google Sheets can often recognize them automatically and place them correctly on the horizontal axis. If the data includes text categories, such as product names or departments, those categories can be used as labels in bar charts, column charts, and pie charts.
How to Insert a Chart in Google Sheets
Once the data is ready, the user can create a chart through the main menu. The process is straightforward and works for most common graph types.
- Open the spreadsheet in Google Sheets.
- Select the data range that should be included in the chart.
- Click Insert in the top menu.
- Choose Chart.
- Wait for Google Sheets to generate an automatic chart.
After the chart appears, Google Sheets opens the Chart editor on the right side of the screen. This editor is where the user can change the chart type, data range, series, labels, titles, colors, and other settings.
Google Sheets tries to guess the best chart type based on the selected data. Sometimes the automatic choice is useful, but in many cases, the user will want to change it. For example, Google Sheets might create a column chart when a line chart would better show a trend over time.
Choosing the Right Chart Type
The chart type should match the purpose of the data. A chart is most effective when it answers a specific question, such as Which product sold the most?, How did revenue change over time?, or What percentage of the budget went to each category?
In the Chart editor, the user can open the Setup tab and select a chart type from the drop-down menu. Google Sheets offers many options, but several are especially common.
- Column chart: Useful for comparing values across categories, such as monthly revenue or team performance.
- Bar chart: Similar to a column chart, but horizontal. It works well when category names are long.
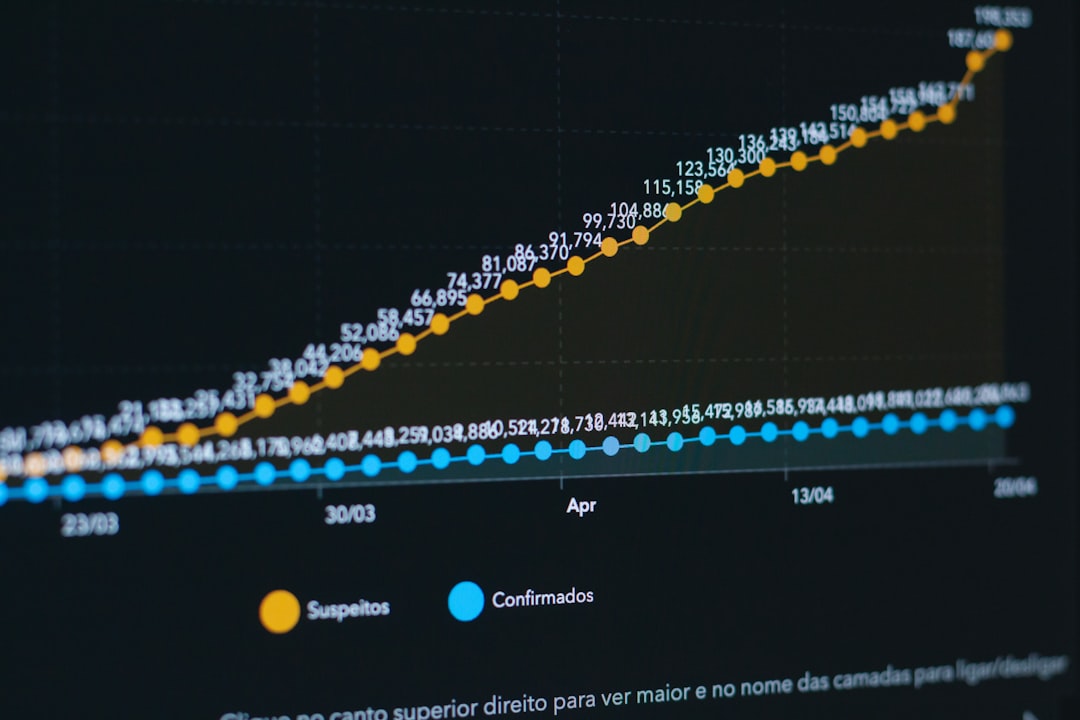
- Line chart: Best for showing trends over time, such as traffic growth, stock prices, or weekly sales.
- Pie chart: Useful for showing parts of a whole, such as budget shares or survey response percentages.
- Scatter chart: Helpful for showing relationships between two numeric variables.
- Area chart: Good for showing cumulative trends or volume changes over time.
A user should avoid selecting a chart type only because it looks attractive. The best chart is the one that makes the data easier to read. For example, a pie chart with ten categories may become cluttered, while a bar chart with the same data may be much easier to understand.

Customizing the Chart Title and Labels
After choosing the chart type, the next step is usually customization. A chart should have a clear title that tells viewers what they are looking at. In the Chart editor, the user can click the Customize tab and open the Chart & axis titles section.
From there, the user can edit the chart title, horizontal axis title, and vertical axis title. For example, a chart title could be Monthly Sales Revenue, while the horizontal axis could be labeled Month and the vertical axis could be labeled Revenue in Dollars.
Good labels reduce confusion. If the vertical axis shows percentages, the axis title should say so. If the numbers represent thousands, the title or labels should make that clear. A viewer should not have to guess what the chart means.
Changing Colors, Fonts, and Style
Google Sheets allows users to adjust how charts look. In the Customize tab, several sections control appearance, including Chart style, Series, Legend, and Gridlines and ticks.
Color can help separate data series and highlight important information. However, too many bright colors can make a chart look busy. A simple color palette often works best. If the chart will be used in a report or presentation, the colors should be easy to see and consistent with the document’s style.
- Background color: Changes the area behind the chart.
- Border color: Adds or changes the outline of the chart.
- Font style: Adjusts how chart titles, legends, and labels appear.
- Series color: Changes the color of individual bars, lines, or slices.
- Legend position: Moves the legend to the top, bottom, left, right, or removes it.
The user should make sure the chart remains readable after customization. Small fonts, low-contrast colors, and excessive gridlines can make a chart harder to interpret. In many cases, simple formatting communicates more effectively than decorative styling.
Editing the Data Range and Series
Sometimes a chart is created with the wrong data range or missing values. This can be fixed in the Setup tab of the Chart editor. The Data range field controls which cells are included in the chart. The user can click the grid icon beside the field and select a new range from the spreadsheet.
The Series section controls which columns or rows appear as chart data. If a column is missing, it can be added as a new series. If an unwanted column appears, it can be removed. Google Sheets also includes options such as Use row 1 as headers and Use column A as labels. These settings are especially useful when the chart is not displaying categories correctly.
For example, if a chart displays numbers on the horizontal axis instead of month names, the user may need to enable the option to use the first column as labels. If the chart title or legend uses generic names, the user may need to confirm that the first row is being used as headers.
Creating a Graph from Multiple Data Series
Google Sheets can display more than one data series in the same chart. This is useful when comparing related values, such as revenue and expenses, desktop and mobile traffic, or planned and actual project costs.
To create a chart with multiple series, the spreadsheet should have one category column and multiple value columns. The user can select the full table, then insert a chart. Google Sheets will often recognize each value column as a separate series. If not, additional series can be added manually in the Setup tab.
A line chart is often effective for comparing trends over time, while a column chart works well for comparing values side by side. If one series uses much larger numbers than another, the user may consider using a combo chart or a secondary axis. This can prevent smaller values from becoming nearly invisible.
Moving, Resizing, and Sharing a Chart
After a chart is created, it can be moved by clicking and dragging it to a new location on the sheet. It can also be resized by dragging the corners or edges. Placement matters when the chart is part of a dashboard or report. The chart should be close enough to the source data or summary area to make sense, but not so close that it crowds the spreadsheet.
Google Sheets charts can also be copied into Google Docs or Google Slides. When pasted, the user may choose to link the chart to the original spreadsheet. A linked chart can be updated later if the spreadsheet data changes. This feature is useful for reports and presentations that need refreshed numbers.
Best Practices for Better Charts
A chart should make information easier to understand, not more complicated. The user should decide what message the chart needs to communicate before making design choices. If the goal is to show growth, a line chart with a clear time axis may be best. If the goal is to compare categories, a bar or column chart may be stronger.
- Keep the chart focused: Include only the data needed to support the main point.
- Use descriptive titles: A title should explain the chart’s purpose clearly.
- Choose readable labels: Avoid crowded text and unclear abbreviations.
- Limit visual clutter: Remove unnecessary gridlines, legends, or effects.
- Check accuracy: Confirm that the chart uses the correct data range and scale.
It is also important to consider the audience. A technical audience may understand detailed scatter plots or complex combo charts, while a general audience may benefit from simpler visuals. A chart should support decision-making by presenting information clearly and honestly.
Common Problems and How to Fix Them
If a chart does not look right, the issue is often related to the data structure. Blank cells, merged cells, inconsistent date formats, or missing headers can confuse Google Sheets. The user should review the source table and make sure it is clean and consistent.
If the chart displays the wrong labels, the user should check whether Google Sheets is using the correct row and column as headers. If the chart includes too much data, the data range can be narrowed. If the wrong chart type was selected automatically, it can be changed from the Chart type menu.
Another common issue is poor readability. Labels may overlap, numbers may be too small, or colors may not contrast enough. Rotating labels, resizing the chart, changing fonts, or selecting a different chart type can often solve these problems.
FAQ
How does a user make a chart in Google Sheets?
A user can make a chart by selecting the data, clicking Insert, and choosing Chart. Google Sheets will create a chart and open the Chart editor for customization.
What is the best chart type in Google Sheets?
The best chart type depends on the data. A line chart is best for trends over time, a bar or column chart is best for comparisons, and a pie chart is best for showing parts of a whole.
How can a chart title be changed?
The user can click the chart, open the Chart editor, select the Customize tab, and use the Chart & axis titles section to edit the title.
Can Google Sheets charts update automatically?
Yes. When the source data changes, the chart in Google Sheets usually updates automatically. If the chart is linked in Google Docs or Google Slides, it can also be updated there.
How can a user change the chart data range?
The data range can be changed in the Setup tab of the Chart editor. The user can edit the range manually or select a new range directly from the sheet.
Why is the chart not showing the correct labels?
This usually happens when Google Sheets does not recognize the header row or label column. The user should check the options for Use row 1 as headers and Use column A as labels in the Setup tab.

